Solving Problems
Lines and graphs have many real-world applications. See the example below for more information about how to use linear graphs to solve problems.
Example
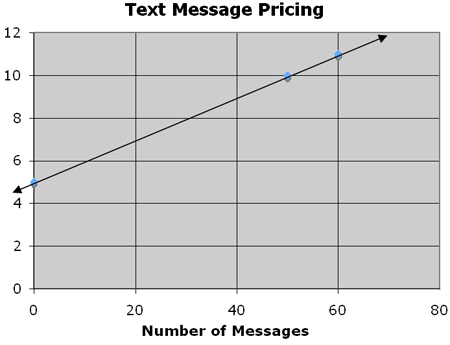
The text messaging rates of a cell phone company are graphed below.

- What is the y-intercept? What does it represent?
The y-intercept is 5. This means that it costs 5 to send 0 messages. This is the initial rate for the plan.
- What is the slope? What does it represent?

The slope is .1, which is 10 cents. The rate is 10 cents per message.
- What is the equation of the line?
m = 0.1, b = 5
y = 0.1x + 5
- Use the equation to determine the cost of sending 100 messages.
y = 0.1x + 5
y = 0.1(100) + 5
y = 10 + 5
y = 15