Graphing Lines in Slope-Intercept Form
Instead of plotting points on a line, you can also use the slope-intercept form of an equation to graph a line. The equation is easiest to graph in slope-intercept form.
![]() Example: Graphing Lines in Slope-Intercept Form
Example: Graphing Lines in Slope-Intercept Form
Let’s work through an example of graphing a line that is in slope-intercept form. Select the play button to begin the example, and then use the solve button to view the solution and use the navigation buttons to pause/stop the example. View the presentation as often as you would like, and take notes as you follow along. Be sure to set your volume at a reasonable level before you begin.
Download the activity as a PDF.
There are two notable exceptions.
Vertical lines have equations of the form x = a number.

In the graph above, the equation of the line is x = 2. Why is the equation x = 2? Take a look at several points on the line.
(2, 0)
(2, 1)
(2, -1)
Notice that in each of these points, the x-coordinate is equal to 2. This true for ALL points on the line. Notice also that the line will never cross the y-axis. This means that y is not a part of this equation. For these reasons, the equation is x = 2.
Remember that vertical lines have undefined slope.
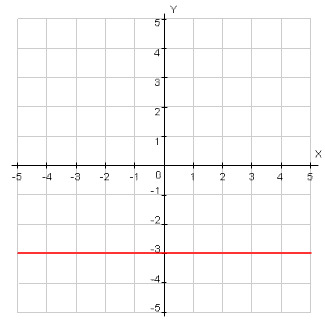
Horizontal lines have equations of the form y = a number.

In the graph above, the equation of the line is y = -3. . Why is the equation y = -3? Take a look at several points on the line.
(2, -3)
(0, -3)
(-2, -3)
Notice that in each of these points, the y-coordinate is equal to -3. This true for ALL points on the line. Notice also that the line will never cross the x-axis. This means that x is not a part of this equation. For these reasons, the equation is y = -3.
Recall that horizontal lines have a slope of 0.