Module 2: Section 4
Compare and Contrast: Venn Diagram
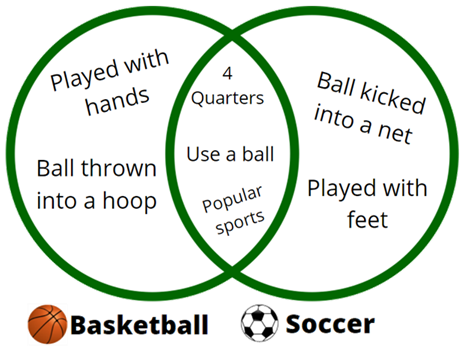
When you compile your ideas into a Vem diagram, it will look like the image below.
Looking at the diagram, you can see that it consists of two overlapping circles. The circle on the left contains information specific to basketball, while the circle on the right contains information specific to soccer. In the center, you can see the information or qualities that both sports have in common.
If comparing three or more things, the Venn diagram will consist of an additional circle for each additional item. If you were to add golf, volleyball, or football to your sports comparison, each would have its own circle, with the overlapping portion containing qualities that each sport shares.