Review of Slope
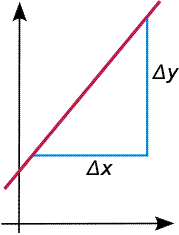
Slope is a measure of steepness. Imagine skiing down a mountain. The steeper the slope, the harder the skiing. In terms of a linear function, we can also find the slope and this slope helps us graph linear functions.
If points (x1, y1) and (x2, y2) lie on a line, then the slope, m, of the line is given by:
You may also remember slope as being referred to as ![]() or
or ![]() , where delta y and delta x represent the change in the y and x directions.
, where delta y and delta x represent the change in the y and x directions.
Slope
Let’s go through an example. Find the slope between points (5, 6) and (-2, 1).
Use the slope formula, ![]() .
.
Label your points so that you can keep the points straight:
x1 = 5
x2 = -2
y1 = 6
y2 = 1
Now substitute your values into the slope equation:
There are a few things to remember. If y2 – y1 = 0 then slope equals zero. If x2 – x1 = 0 then the slope is undefined, since you can never have a zero value in the denominator of a fraction. We will discuss the graphs of these two situations later in this section.
