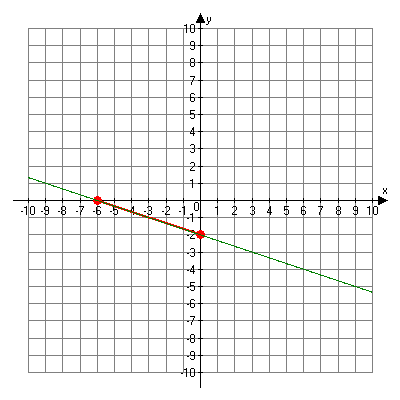
Graphing Using Intercepts
Graphing using x- and y-intercepts is another way to draw a line. If you have the equation
x + 3y = -6, in order to graph this equation using slope-intercept form, we would have to rewrite the equation first. There is an easier way. We can use x- and y-intercepts. The x-intercept occurs when y = 0. The y-intercept occurs when x = 0. We can use this fact to find two points on the graph.
Given x + 3y = -6
Let x = 0
0 + 3y = -6
y = -2
The y-intercept is therefore (0, -2).
Let y = 0
x + 3(0) = -6
x = -6
The x-intercept is (-6, 0).
We can now graph the line.

Graph using intercepts