Graphing Linear Functions
Given what you just learned about writing equations, we can now move on to graphing equations. You have all the information that you need to graph equations. Let’s work through an example. Graph ![]() . From the equation we see that the slope is equal to
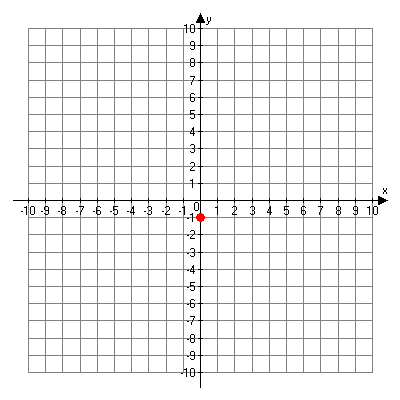
. From the equation we see that the slope is equal to ![]() and the y-intercept is equal to -1. Start by graphing the point (0, -1), where the graph crosses the y-axis.
and the y-intercept is equal to -1. Start by graphing the point (0, -1), where the graph crosses the y-axis.

Point (0, -1)
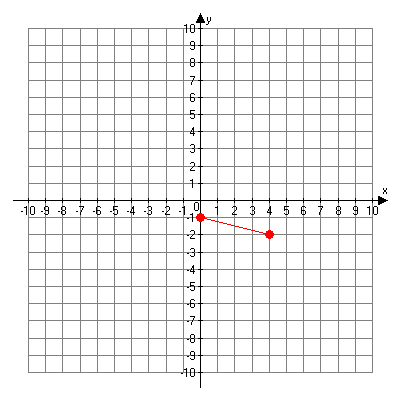
Now you can use the slope of the equation to find the next point. Since the slope is negative, the graph will slope downwards and to the right moving from left to right. You move one unit down (rise) and 4 units to the right (run).

Points (0, -1) and (4, -2)
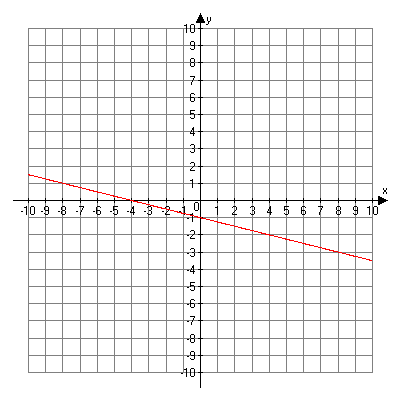
Finally, we can connect the two points and graph our line.

Graph of ![]()