Graphing Inequalities
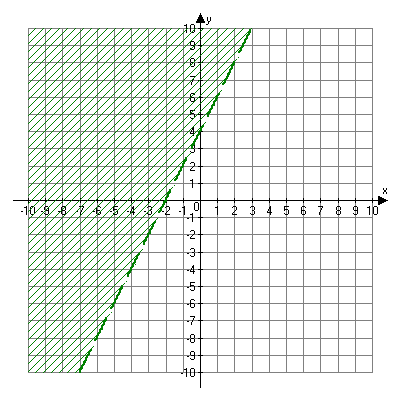
Inequalities have an infinite number of points that satisfy the inequality. For example, the inequality  will work for (0, 5), (1, 7) and an infinite number of other points. The way we show the solution to an inequality is to shade the solution area of the coordinate plane, referred to as a half-plane.
Graphing an inequality starts out exactly like graphing an equation. Let’s go through the steps of graphing  .
.
Inequalities with < and > signs are graphed with a dashed line since they do not include the points on the line.
Inequalities with ≥ and ≤ signs are graphed with solid lines since they do include the points on the line.
Since we are graphing  , nothing on the line y = 2x + 4 is going to be included in our solution.
Start by graphing y = 2x + 4. Next decide which side of the graph will be shaded. The best way to do that is to pick a point to check. Try to choose (0, 0) as your point, unless it falls on the line. It is the easiest to check.

Graphing a Linear Inequality
Since (0, 0) does not fall on the line, we are going to use this point to check our inequality.
0 > 2(0) + 4
0 > 4
This statement is not correct. If (0, 0) does not work in the inequality, then every point on the same side of the line will also not work. We will shade the graph on the other side of the line. If you check any point on this side of the graph, it will produce a correct statement.

Graph of y > 2x + 4
Click here if you would like to review more about graphing linear equations, inequalities, or points.