Writing a Linear Equation From a Graph
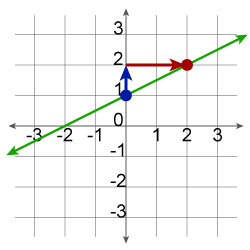
Finally, you might be given a graph and asked to find the equation of the line. For example, find the equation of the following line:

What is the equation of this graph?
The first step is to determine whether the slope of the line is positive or negative.
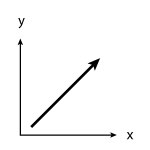
Positive slope increases from left to right:

Positive Slope
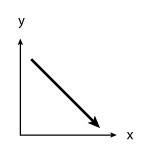
Negative slope decreases from left to right.

Negative Slope
In our example we see that the slope is positive. We can also look at the graph to see that the
y-intercept is at 1. These are key pieces of information as you try to build the linear equation. The next step is to find the slope. Choose two points to determine the slope. As a rule, you should choose the y-intercept as one of your points.

Graph of the equation ![]()
We know that slope is equal to rise/run.
Rise, shown in blue, is 1.
Run, show in red, is 2.