 Mini-Lab Conclusions Self-Check
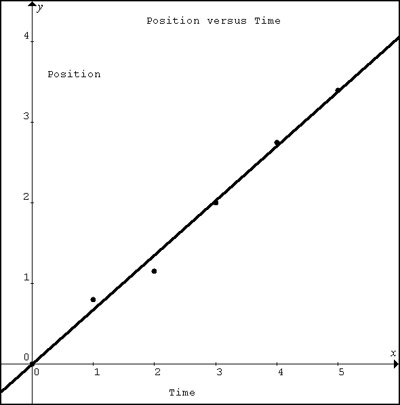
What did you find out? Using the graph you just created, complete this self-check activity by looking at the prompts below, thinking about it, and then clicking on the question to review the explanation. Your graph should look something like the one below.

What are the units for the slope of your graph?
m/s
|
|
|
What does this value represent?
The rate at which the car/truck changes position.
|
|
|
What do we call this in "everyday" language?
speed or velocity
|
|
|
What does the y-intercept represent?
The initial position of the car/truck. In this case, it should be close to zero.
|
|
|
What is the equation for your line of best fit?
Your answer will vary depending on how fast your car moves, but it should look something like this:
Where x is position, t is time, the slope represents speed, and the y-intercept is the starting position. Generally, it is a safe assumption to say that the slope is equal to 0 if it is within 5% of zero. |
|
|
How would you generalize this relationship to model all constant speed motion?
You can generalize this mathematical relationship to model all constant speed motion by writing the general form of the equation from the mini-lab:
Where x is position, t is time, the |