Graphical Analysis
Graphical analysis is a key skill in working with motion. It is important to establish a foundation for analyzing motion graphs now so that you can continue to apply it to future studies of motion (two-dimensional motion, Newton’s Laws)
Recall the graph you created in the battery operated car mini-lab. The battery-operated car moving with constant speed produced a linear position-time graph. In some earlier explorations, you saw that accelerated motion had curved position-time graphs. Let’s explore how the position-time graph, the velocity-time graph, and the acceleration-time graphs are associated.
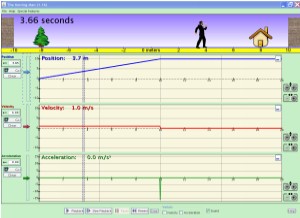
The Running Man
Click the image to view the animation.

Click to Run. Please wait for the animation to completely download. Then follow the instructions for your browser.
Play around with it for a few minutes to see the different ways you can manipulate the man (you can drag him around, change position, velocity, or acceleration by dragging the sliders, or type values in for position, velocity, or acceleration). Look specifically in each situation at what the position-time graph, velocity-time graph, and acceleration-time graph look like. Then answer the questions below. Click on them to see an explanation.
Position-Time Graphs
 |
How do you produce a linear graph with a non-zero, positive slope on the position-time graph?
With a constant positive velocity.
|
 |
How do you produce a linear graph with a non-zero, negative slope on the position-time graph?
With a constant negative velocity.
|
 |
What does the position-time graph look like when the man is walking to the right?
The graph slopes up or gets more positive. |
 |
What does the position-time graph look like when the man is walking to the left?
The graph slopes down or gets more negative.
|
 |
How do you produce an upward opening parabola on the position-time graph?
With a constant positive acceleration.
|
 |
How do you produce a bottom opening parabola on the position-time graph?
With a constant negative acceleration.
|
Next »
Velocity-Time Graphs
 |
How do you produce a horizontal line in the positive region?
With a constant positive velocity.
|
 |
How do you produce a horizontal line in the negative region?
With a constant negative velocity.
|
 |
How do you produce a linear graph with a positive slope?
With a constant positive acceleration.
|
 |
How do you produce a linear graph with a negative slope?
With a constant negative acceleration.
|
 |
What does the area under the curve of the graph tell you? (Hint: look at the units when you multiply the base times the height or ½ base times height).
The area under the curve produces a unit of meters, thus the area under the curve of a velocity-time graph is equal to change in position.
|
« Previous | Next »
Acceleration-Time Graphs
 |
What does the acceleration-time graph look like with a constant velocity?
It is a horizontal line on the zero.
|
 |
What does the acceleration-time graph look like with a constant acceleration?
It is a horizontal line in either the positive region (positive acceleration) or negative region (negative acceleration).
|
 |
What does the area under the curve of the graph tell you? (Hint: look at the units when you multiply the base times the height).
The area under the curve produces a unit of meters per second, thus the area under the curve of a acceleration-time graph is equal to change in velocity.
|
« Previous
© 2009 KC Distance Learning. All rights reserved.
