 Warm-Up: Battery Operated Car Mini-Lab
Getting Started:
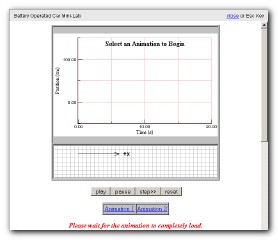
For this mini-lab, you’ll need a battery operated car. If you do not have access to one or cannot find one at the store, view this animation on distance traveled and displacement. After looking at the illustration, come back here and read through the procedures and analysis so you are prepared to answer the questions that follow. Click the image below to view the animation.
Materials:
1 stopwatch
1 battery operated car or truck
1 measuring tape or meter stick
Procedure:
In this mini-lab you will study the relationship between position and time of a battery operated car. The car must travel with a constant speed (i.e. not one that uses friction to start but is turned on and off with a switch and moves relatively slowly).
Set an arbitrary point on the ground that will be your initial (zero) position. Ready with the stopwatch, place the car at the zero position and have it move in a straight line away from that point. Measure how far the car travels in one, two, three, four, and five seconds. This will allow you to plot a graph of time on the horizontal axis (dependent variable) and position in meters on the vertical axis (independent variable). Make sure to control all other variables.
Note: For convenience, treat all objects as a point. It is important that you reference the motion of an object from one point and be consistent with referring to that point (i.e. if talking about a car’s motion, choose a point on that car, say the front bumper, and describe the motion accordingly. Do not, however, change to the rear bumper in the middle of a problem!
![]() Reminder—multiple trials are always a good idea. You should NEVER conduct an investigation with less than three trials with at least five data points each.
Reminder—multiple trials are always a good idea. You should NEVER conduct an investigation with less than three trials with at least five data points each.
Analysis:
Create a graph that shows the relationship between time and position. Draw a line of best fit through the data and describe the relationship in general terms (point-slope form of the line). You may use the whiteboard below or use your graphing calculator to create your graph and find the best fit line.
