Domain and Range (continued)
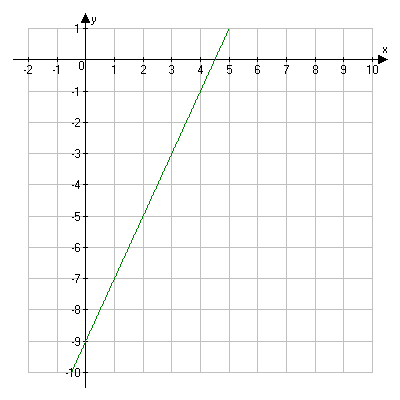
Domain and range can also be found by looking at an equation. For example, look at f(x) = 2x – 9. One way of analyzing this equation is to graph it. You can either use paper and pencil, a graphing calculator, or you can use the following graphing utility GCalc. Click on the GCalc image below. When the GCalc application opens, double click on the "Graph Plugin" to graph a linear equation. To adjust the window properties, go to the "Edit" menu and then "Properties". Click on the "View" tab and adjust the maximum and minimum x- and y-values.
Here is what the graph looks like:

Domain and Range
