Estimating Exponential and Logarithmic Values Based on a Graph
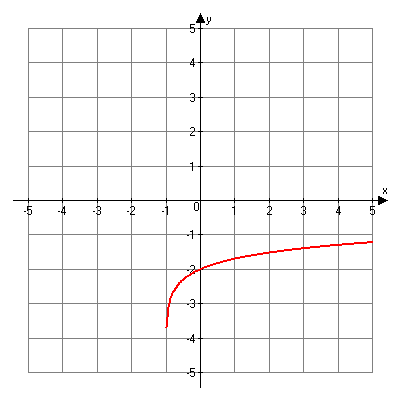
You may also be given a graph and asked to estimate the value of a function based on some given x-value. For example, analyze the following graph.

f(x) = log(x + 1) – 2
Suppose you want to find the approximate value of the function at x = 2. If you look at the graph closely you will see that the y or f(x) value at x = 2 is approximately -1.5. This means that
f(2) ≈ -1.5. Now go back and check your work in the warm-up activity to make sure that your answers are correct.
![]() Review Worksheet
Review Worksheet
Complete the review worksheet for this section before taking the quiz. Download the review worksheet, complete the questions, and then download the answer key to check your work. Make sure to ask your teacher any questions.