Solutions of Systems of Inequalities
In the warm-up, you practiced graphing linear inequalities. In this section we are going to solve systems of inequalities, which means two or more linear inequalities in two variables. This is done by graphing.
If you need extra practice graphing linear inequalities, before tackling systems of linear inequalities, download the following review.
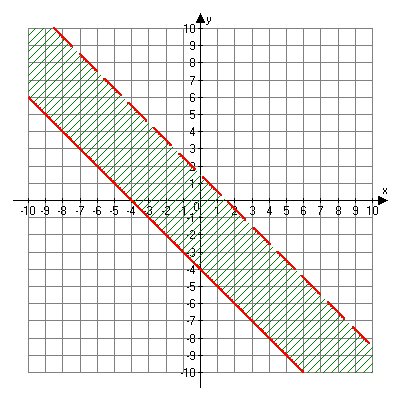
Analyze the following graph:

The above graph represents the system of inequalities
x + y ≥ -4
2x + 2y < 3
The shaded region is where the shading from both graphs overlaps. This is the solution to this system of inequalities. For example, (-2, 0) and (1, -2) are solutions to this system of inequalities because they appear in the shaded region. On the other hand, (3, 0) and (-7, -5) are not solutions because these points do not appear in the shaded region.
It is important to note whether a line is less than or greater than, or if a line is less than or equal to or greater than or equal to. For example, for line x + y ≥ -4, all points on the line are included in the solution. For line 2x + 2y < 3, the points are not included in the solution.