Graphing Systems of Inequalities
Now that we know what a solution to a system of inequalities looks like, let’s go through how to graph and find the solution from beginning to end.
The process involves graphing the separate inequalities and identifying where the shading overlaps. Let’s look at an example.
Find the solution of:
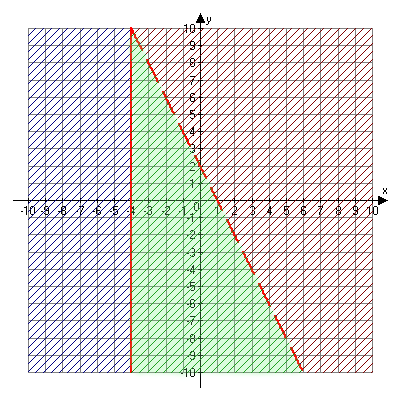
2x + y < 2
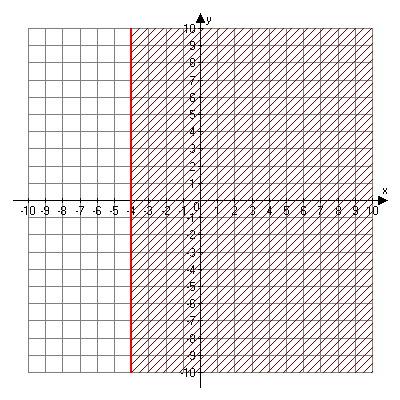
x ≥ -4
First, let's graph x ≥ -4.

Next, graph 2x + y < 2 on top of your existing graph.

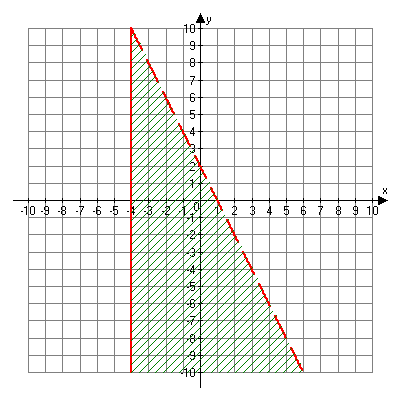
Finally, only graph the portion of the graph where the shading overlaps. This is the solution to the system of linear inequalities.
