Exponential and Logarithmic Functions: Graphing Exponential Functions and Domain and Range

The Graph of f(x) = bx

In order to take a closer look at the transformations of exponential functions, start by looking at some simple functions.

The following is the graph of f(x) = 2x.
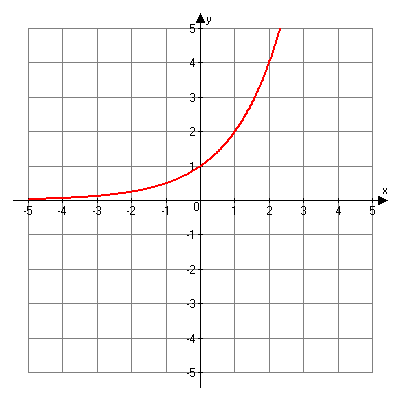
Graph of f of x is equal to two to the x power.

This is an example of exponential growth. Notice that as x increases the y-values increase exponentially.

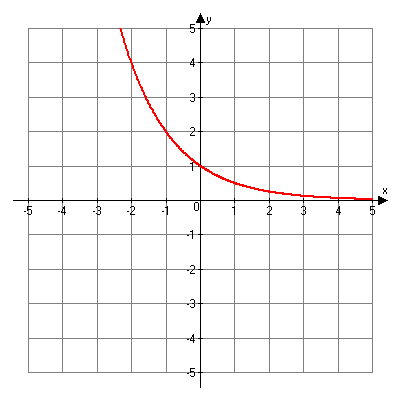
The following is the graph of f of x equals one-half to the x power.

Graph of f of x is equal to one half to the x power

This graph is an example of exponential decay. As the x-values increase the y-values decrease exponentially.