Exponential and Logarithmic Functions: Graphing Logarithmic Functions and Domain and Range

Domain and Range and Logarithmic Functions

Let’s analyze the domain and range of logarithmic functions.

Graph of f of x equals log x
f(x) = log(x)

The logarithmic function is the inverse of the exponential function. If we look at the graph we notice that any y-value will work in the function. This means the range is equal to All Real Numbers. Only x-values greater than zero will work in this function since x = 0 is an asymptote. This means the domain is x > 0.

Let’s see what happens when the functions is transformed.
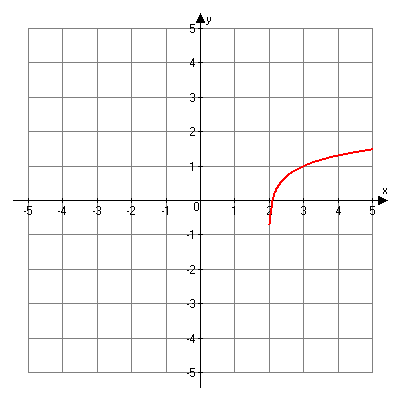
Graph of f of x equals log of the quantity x minus two, plus one
f(x) = log(x – 2) + 1

This is the graph of f(x) = log(x – 2) + 1. The graph has a vertical translation of 1 unit up and a horizontal translation of 2 units to the right. The vertical translation has no affect on the range. It is still All Real Numbers. Since the graph was translated 2 units to the right, the domain has changed to x > 2 since the asymptote is x = 2.