Graphing Exponential Growth and Decay
Click the play button ( ![]() ) below to listen to more information about exponential growth and decay. Be sure to set your volume at a reasonable level before you begin.
) below to listen to more information about exponential growth and decay. Be sure to set your volume at a reasonable level before you begin.
Download a script of the audio.
You can recognize if a function represents an exponential growth or decay by looking at the b value of f(x) = bx. If b < 1 then the function represents an exponential decay. If b > 1, the function represents an exponential growth.
For example, the function f(x) = 3.5x represents an exponential growth. The function f(x) = (0.5)x represents an exponential decay.
The following is the graph of f(x) = 3.5x.

This graph represents an exponential growth. Notice the graph increases from left to right at an exponential rate.
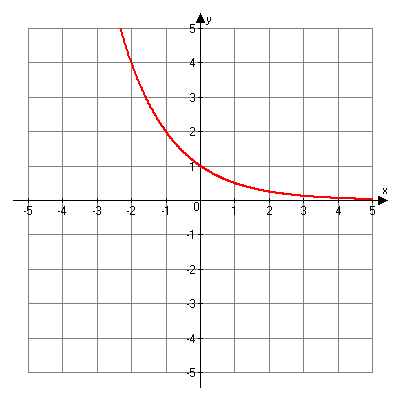
The following is the graph of f(x) = (0.5)x which can also be written as f(x) = ![]() .
.

This graph represents an exponential decay. Notice the graph decreases from left to right at an exponential rate.
![]() Review Worksheet
Review Worksheet
Complete the review worksheet for this section before taking the quiz. Download the review worksheet, complete the questions, and then download the answer key to check your work. Make sure to ask your teacher any questions.