Graphing Quadratic Functions Using Zeros and Vertex
We can put our information about zeros and vertices together to graph quadratic functions that are not in vertex form, meaning you have not completed the square.
Let’s graph the function f(x) = x2 – 2x – 15.
The first step is to find the zeros.
x2 – 2x – 15 = 0
(x – 5)(x + 3) = 0
x = 5 or -3
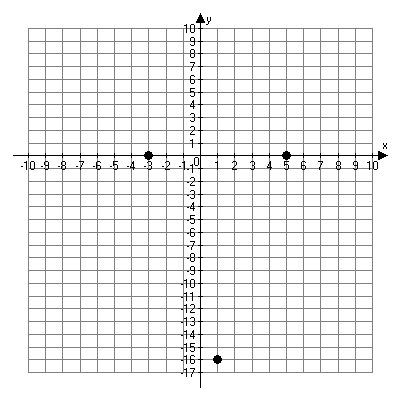
Graph these two points on the coordinate plane.

Graph of the zeros of the function
Now find the vertex.
k = f(1) = 12 – 2(1) – 15 = 1 – 2 – 15 = -16
Vertex = (h, k) = (1, -16)
Add this point to the graph.

Graph of zeros and vertex
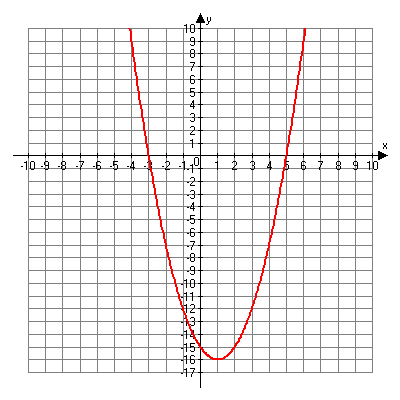
Graph the final function.

Graph of f(x) = x2 – 2x – 15
Graphing Calculator
Using your graphing calculator can save a lot of time when graphing functions. Follow these simple keystrokes to graph the function: y = x2 – 25. Your graph should look similar to the one shown.
1. Touch "Y=" button. (upper left-hand corner)
2. Touch "x" button. (next to the “ALPHA” button, which is often a different color)
3. Touch "x2" button. (1st column about ½ way down)
4. Touch "–" (subtraction)
5. Touch "25"
6. Touch "Graph" button. (upper right-hand corner)
From the graph, you can see the “zeros” are the points the graph crosses the x-axis. The zeros are x = -5, 5. The vertex is at (0, -25).