Domain and Range Given a Graph
You have already learned about the domain and range of linear functions. Quadratic functions also have domain and range. Recall, domain is the set of all the possible x-values and range is the set of all the possible y-values.
The easiest way to tell the domain and range of a function is to look at the graph. This will allow you to see the vertex, which is a very important element of analyzing domain and range.
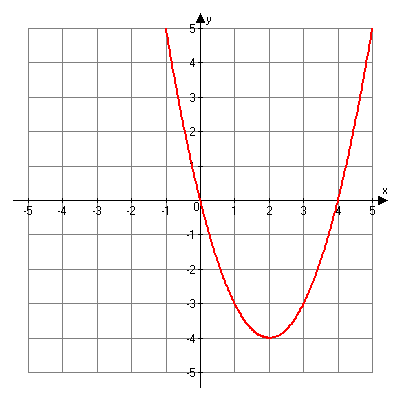
Analyze the following graph.

Graph of a quadratic with a > 0
The "a" value of this graph must be positive since the quadratic opens upward. If we look at the domain, or all the possible values of x, we see that eventually the entire coordinate plane would be covered by this function and it would go on forever. Therefore, the domain is All Real Numbers.
If you look at the range, you see that only the values at y = -4 and greater will be covered by this function. Therefore, the range is y ≥ -4.
The vertex of this function is at (2, -4).
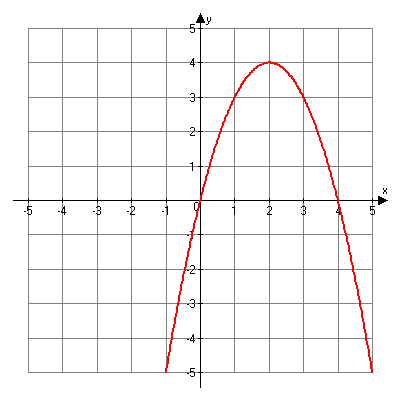
Now analyze the next graph.

Graph of quadratic with a < 0
This time we see that the "a" value must be negative since the graph opens downward. The domain does not change; it is still All Real Numbers. Imagine the graph going on and on, getting bigger and bigger, and covering the whole x-axis.
The range, on the other hand, does change. Now the y-values start at y = 4 and get smaller. Therefore, the range of this function is y ≤ 4.
The vertex of this function is at (2, 4).