Maximum and Minimum Values

Working Towards a Solution
The vertex is either a maximum or minimum point on the graph. The following is a description of how to analyze a function and tell whether there is a maximum or minimum value.
Let f(x) = ax2 + bx + c, where a ≠ 0.
If a > 0 the graph opens up and the vertex is the minimum value.
If a < 0 the graph opens down and the vertex is the maximum value.
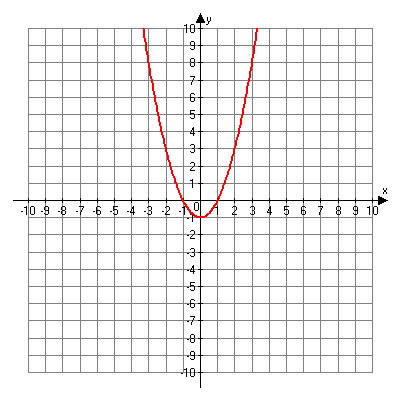
For example, the following is the graph of f(x) = x2 – 1.

Graph of f(x) = x2 – 1