The Value of "h"

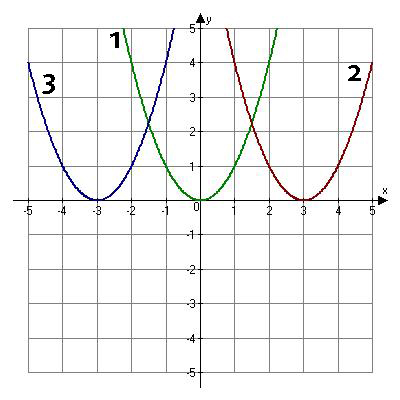
The value of "h" in the function f(x) = a(x – h)2 + k describes how the parent function moves left or right.
Analyze the following graph:

- The green graph is the parent function f(x) = x2.
- The red graph is the function f(x) = (x – 3)2.
- The blue graph is the function f(x) = (x + 3)2.
Click the play button ( ![]() ) below to listen to more information about quadratic functions. Be sure to set your volume at a reasonable level before you begin.
) below to listen to more information about quadratic functions. Be sure to set your volume at a reasonable level before you begin.
Click to download a script of the audio.