The Value of "a"

Let’s concentrate on the "a" in the vertex form function f(x) = a(x – h)2 + k. The "a" either stretches or compresses the parent function. This will make the parabola fatter or thinner.
Let’s try to figure out what value of "a" has what affect on the function.
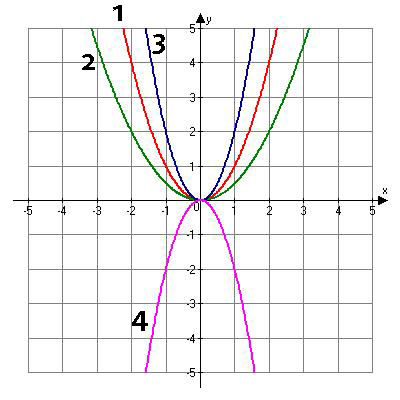
Analyze the following graph:

- The red graph represents f(x) = x2.
- The green graph represents
 .
. - The blue graph represents f(x) = 2x2.
- The purple graph represents f(x) = -2x2.
If you analyze these four graphs you will come to the conclusion that an "a" value between 0 and 1 compresses the function and makes it fatter. An "a" value greater than zero stretches the function and makes it skinnier.
![]() > 1 stretches the parent function f(x) = x2, making it skinner.
> 1 stretches the parent function f(x) = x2, making it skinner.
0 < ![]() < 1 compresses the parent function f(x) = x2, making it fatter.
< 1 compresses the parent function f(x) = x2, making it fatter.