The Value of "k"

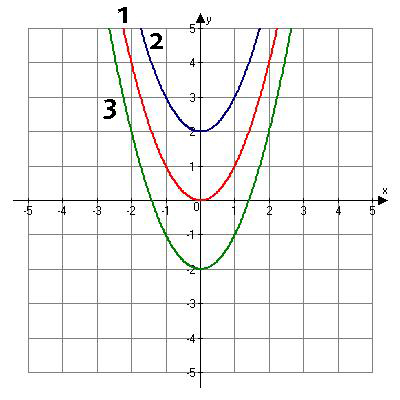
The value of "k" in the function f(x) = a(x – h)2 + k describes how the parent function moves up or down.
Analyze the following graph:

- The red graph is the parent function f(x) = x2.
- The blue graph represents f(x) = x2 + 2.
- The green graph represents f(x) = x2 – 2.
If we analyze the "k" value for all three functions we notice that a "k" value greater than zero moves the function up  units. A "k" value less than zero moves the function down
  units.
k > 0 moves the parent function f(x) = x2 up  units.
 units.