Slope Between Points
| Slope is the ratio of the change in vertical distance (y-axis) to the change in horizontal distance (x-axis) between two points. Another phrase used for slope is the rate of change. |
Refer to the chart below. A company delivers food from local restaurants. They charge a $5 flat delivery charge, plus a fee for every order that you place. Looking at the graph, can you determine how much they charge per order?
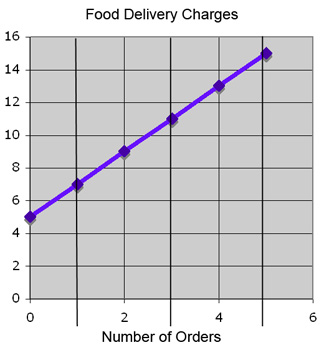
From the graph, we see that one order costs $7, but we know that there is a $5 delivery charge. Therefore, we can determine that each order costs $2 because a change of one unit on the x-axis (one order) led to a change of 2 units on the y-axis (dollars). This is confirmed by looking at the next point. Adding one more order adds $2 to the cost. Slope is represented mathematically using the following formula:
|

Example 1
Refer to the points on the chart again. (1, 7) and (2, 9) are points on the line. Even without the graph, we could have determined the slope using the formula.
x1 = 1, y1 = 7; x2 = 2, y2 = 9
Note: It does not matter which point you choose to be point 1 and which point you choose to be point 2. Just make sure you are consistent once you’ve chosen your points.
Example 2
Fine the slope of the line that passes through the points (3, -2) and (7, 5).