Domain of Sine and Cosine Functions
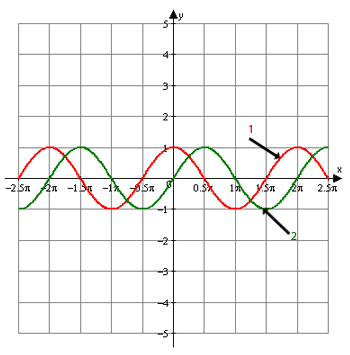
Analyze the graphs of the sine and cosine functions.

1. Red Graph: y = cos x
2. Green Graph: y = sin x
The graphs cover all of the x-values in both directions. That means that the domain of both the cosine and sine functions is All Real Numbers. No matter how the graph is transformed the domain does not change.
The graph is between y = -1 and y = 1. The range of the cosine and sine functions is -1 ≤ y ≤ 1.If the graph is translated vertically or if the graph has an amplitude other than a = 1, this will change the range. Graph the function to make sure that you have the right range.
You can use the GCalc Graph Utility to check your domain and range and to check if you have graphed a trigonometric function correctly.
Click on the GCalc image. Double click on the "Graph Plugin" to graph a linear equation. To adjust the window properties, go to the "Edit" menus and then "Properties". Click on the "View" tab and adjust the maximum and minimum x- and y-values.
