Solving Rational Inequalities Using Graphs
There are several ways to solve rational inequalities. One way is to use a graph. You can either use your graphing calculator or GCalc.
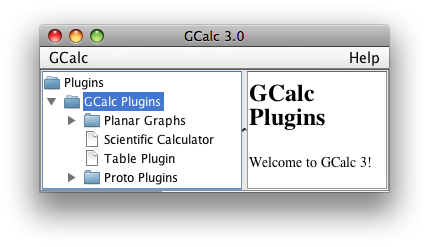
Click on the GCalc image. Double click on the "Graph Plugin" to graph a linear equation. Double click on the "Inequalities Plugin" to graph an inequality. To adjust the window properties, go to the "Edit" menus and then "Properties". Click on the "View" tab and adjust the maximum and minimum x- and y-values.
Suppose you want to solve  .
.
There are two ways you can do this: using the graphs of each function or graphing the inequality.
First, let’s look at the graphs of the corresponding equations. Using each side of the inequality, graph both  and y = -3.

 and y = -3
If you analyze the graph closely you will see that the red graph is below (is less than) the green graph at 0 < x <  . The graph allows you to see the inequality
  visually.
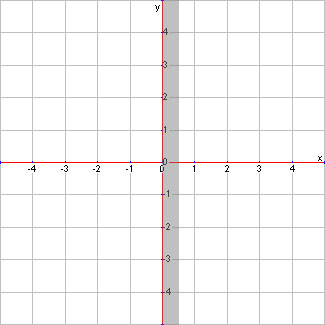
The second way is to use GCalc to graph the inequality  . The graph will look like this:

Notice that the shading is between x = 0 and x =  . This gives the same result as the previous graph: 0 < x <
  .
.
