Population Structure & Pyramids
In an ecosystem that has been around for a long time without many dramatic environmental changes, the population will just continue to grow indefinitely, right?
Wrong! Population dynamics is a field of study within ecology that looks at how populations change over time. Population dynamics tells us that no population can continue to grow indefinitely because of limits on resource availability and competition for those resources.
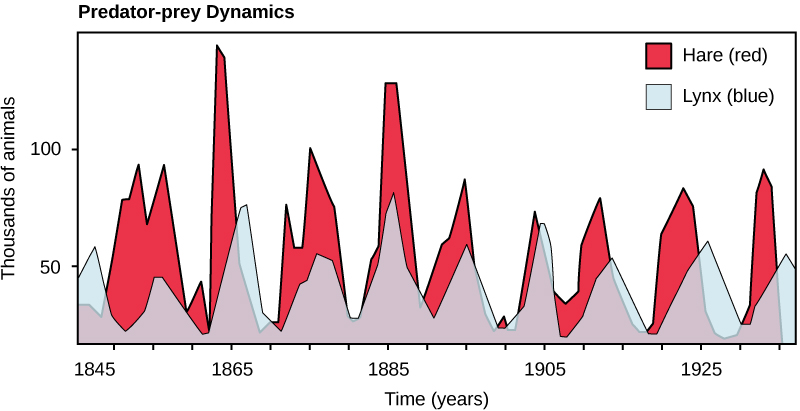
Can you think of an example of how populations change over time? A comonly studies realtionship is the example of the hare and lynx. The lynx population relies on the hare population for its very survival. As the hare population increases, so does the lynx population. Eventually, the lynx population will be so large that it will overhunt its prey, reducing the overall population and driving its own population down. This is an example of population change over time.
Population Growth Rates
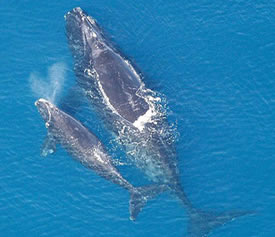
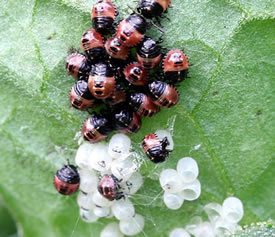
Populations differ in distribution, numbers, age structure [proportions of individuals in different age groups], and density. These factors change depending on environmental conditions. Before we can study how populations change due to disturbances, we need to know what their capacity for growth is under ideal circumstances. This is called biotic potential. Which of the organisms below do you think represents the population with the highest biotic potential? If you said the beetles, you're right! Populations of species with larger individuals usually have low biotic potential, while those of smaller organisms have high biotic potential.
- apes_norhternrightwhalewithcalf_580x519
Whales reproduce later in life, have long time periods between successive generations, and only have one offspring each time they reproduce.
- apes_shelfbeetleshatching_491x580
Insects reproduce early in life, can reproduce many times, have many offspring, and have short time periods between successive generations.
Answer
The rate of population increase for the beetles is much higher than for the whale. This rate is called the intrinsic rate of increase (r), and is routinely shown on population graphs.
J-Curves and S-Curves
Biotic potential isn't the only factor that determines how big a population can get.
Answer
Populations are naturally limited by the availability of resources like food, materials to build shelters for breeding or caring for young, and water supplies. If the density of individuals is too great, there can be too much competition for limited resources. Abiotic factors also limit populations. Genetic diversity can also limit populations. If there is not enough diversity among the genetic pool, successful reproduction becomes difficult. The combination of all the factors that act to limit population growth is called environmental resistance.
Environmental resistance and biotic potential together determine carrying capacity, the maximum population of a given species that a particular habitat can sustain indefinitely without being degraded. Most populations grow exponentially until they reach the carrying capacity, K. During the exponential growth phase, the shape of the graph resembles the letter ‘J', so this is called a j-curve. At this point, a population may fluctuate slightly above and below the carrying capacity. Looking at these fluctuations from the side, they resemble the letter ‘S', and so this is called an s-curve.
- S Shaped Curved
Figure 1 shows the growth of a population following a logistic curve, resulting in the S-shaped graph. This model reaches a stable equilibrium, sustaining the population at the carrying capacity as time continues.
- J Shaped Curve
Figure 2 shows an exponential population growth that results in the J-shaped graph. The rapid growth causes an overshoot where the population is above the carrying capacity, this leads to a die off and unstable equilibrium as the population growth rate fluctuates above and below the carrying capacity. This overshoot and unstable equilibrium can lead to a degraded carrying capacity as the available resources have been destroyed by the overgrown population
Author: Nchisick. The above two graphs are licensed under the Creative Commons Attribution-Share Alike 4.0 International license. They can be accessed here: https://commons.wikimedia.org/wiki/File:Logistic_Carrying_Capacity.svg and https://commons.wikimedia.org/wiki/File:Exponential_Carrying_Capacity.svg
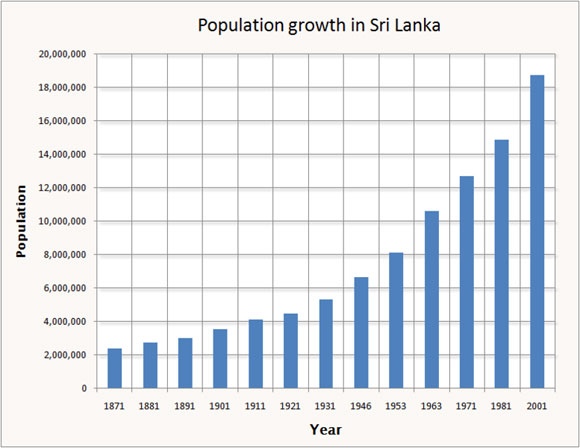
What kind of curve is represented in the graph below? Although this is a bar graph, we can connect the top points of the bars to make a line. This would mean that the human population growth in Sri Lanka describes a J-curve.
Population Crash
American Museum of Natural History
Let's explore population growth and carrying capacity. Carrying capacity, which is defined as the maximum population size that an environment can support, is dependent on food, shelter, water and space available. As resources become scarce and space is limited for a population, the birth rate declines or the death rate increases. In some cases BOTH can occur. If a population exceeds its carrying capacity, there would be a shortage of food, water, shelter and space. Carrying capacity is impacted also by density dependence where facotrs such as competion for limited food, water, shelter and space is greater in high density population areas. High-density populations are at higher rish of predation, disease, and parasitic contraction due to their close proximity to each other. Eventually we would see a population decline and fluctuate around the carrying capacity until an ideal population size can be supported. In some cases if the overshoot is too large, we may witness a population crash, where population numbers become extremely low to nonexistent in the environment.
Population Growth Rate
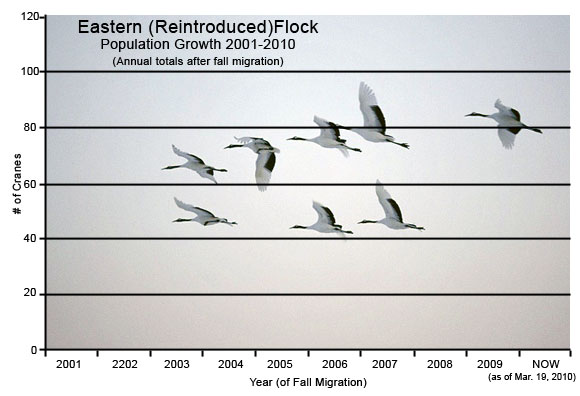
The graph above shows the population of the whooping crane between 2001 and 2010. Use the data on this graph to answer the questions asked under each slider bar below.
What is the annual growth rate of the whooping crane?
Growth rate is usually expressed as a percent change. To find this, we use the formula below:
Growth rate = ((Vpresent-Vpast)/Vpast)*100
Annual growth rate = growth rate/N
In these formulas,
Vpresent = present or future value
Vpast = past or present value
N= number of years
For the whooping crane population, we choose two times, Vpresent and Vpast. Let's use 2004 (population was 50) and 2005 (population was 65), so our calculation will be:
Growth rate = ((65-50)/50) * 100 = 30%
The growth rate between 2004 and 2005 was 30%. The annual growth rate is 30%/1 = 30%.
What is the doubling time of the whooping crane population?
Doubling time is easy to calculate using the Rule of 70. If you have the annual growth rate, all you have to do is divide 70 by the annual growth rate to find the approximate doubling time. For example, at a 10% annual growth rate, doubling time is 70 / 10 = 7 years. Similarly, to get the annual growth rate if you have the doubling time, divide 70 by the doubling time. For example, 70 / 14 years doubling time = 5, or a 5% annual growth rate.
The doubling time for the whooping crane would be 70/ 30= 2.3 years
What will the whooping crane population be in 2015?
Future population can be calculated with the following formula:
Future population = Present Population * (1+i)n
where i= annual growth rate as a decimal
and n = number of years
To find out what the whooping crane population will be in 2015, let's use the annual growth rate and population we calculated for 2005, 30% (written 0.3 as a decimal).
Future population = 65 * (1+ 0.3)10 = 896
That means if the whooping crane population continues to grow at 30% annually, by 2015 there will be 896 cranes!
Let's Review!
Use this game to review the important concepts and skills you learned in this chapter and then proceed to the Biodiversity and Evolution Quiz.
Click the image below.
Text Version
Vocabulary & Concept Review
Review the important concepts and skills you learned in this chapter and then proceed to the Biodiversity and Evolution Quiz and the Ecological Principles Unit Exam.
- Limiting Factors
- Biotic Potential
- Natural Selection
- Specialists
- Extinction
- Ecology
- Biotic/Abiotic Factors
- Food Chains/Webs
- Biomass
- Ecological Succession
- Four Life Support Systems on Earth
- Hydrologic Cycle
- Carbon Cycle
- Nitrogen Cycle
- Phosphorus Cycle
- Sulfur Cycle
- Scientific Process
- Matter
- Energy
- Laws of Thermodynamics
Limiting Factors: Food, shelter, water and other natural resources limit populations.
Biotic Potential: The rate at which a population can increase when there are no limits on its growth rate. Larger animals usually have lower biotic potential than smaller animals
Natural Selection: This is the theory which describes how evolution occurs. It was proposed by Charles Darwin and looks at decent through genetic modification over time. There are many mechanisms including survival of the fittest, reproductive success and the ability to pass this trait to successive offspring.
Specialists: These organisms have a narrow niche, or a specific role within an ecosystem. Specialists are more adversely impacted by non-native species and changes in the environment than generalists.
Extinction: This is the elimination of species from earth and can be due to many factors including climate change, impact events, and eruptions, as well as human impacts to the environment.
Ecology: The study of the relationships between living organisms and their environment.
Biotic and Abiotic Factors: Biotic factors are the living components of the ecosystem such as animals and plants. Abiotic factors are the non-living components such as rocks, water and air.
Food Chains and Food Webs: This is the flow of energy through an ecosystem. A food chain is a simplified one-way flow of energy, whereas a food web is a more complex cycle of energy through the system.
Biomass: Biomass is the total dry weight of all the organic matter contained in each trophic level of a food chain or a food web. Chemical energy stored in biomass is transferred from one trophic level to another as organisms consume items living things on the trophic level below them.
Ecological Succession: The process why which organisms in a particular area are replaced over time by other communities. This may be due to a disturbance.
Four Life Support Systems on Earth: The geosphere, the hydrosphere, the atmosphere and the biosphere are the life support systems on earth. Each of these performs an important and unique function on the earth. These support systems are interconnected so if one is impacted, they all are affected.
Hydrologic Cycle: The water cycle consists of evaporation, transpiration, condensation, precipitation and recharge of the water stored on earth. Reservoirs of water are the ocean, atmosphere, ice and snow, aquifers, lakes and rivers and living things. Humans can impact this cycle by overusing water and clearing vegetation.
Carbon Cycle: The process of photosynthesis and respiration throughout the environment. CO2 and O2 are recycled through this process. Marine sediments are a large reservoir for carbon. Humans impact this cycle in many ways including the use of fossil fuels and deforestation.
Nitrogen Cycle: Nitrification, ammonification, denitrification, and nitrogen-fixation are all part of this process. Reservoirs include soil, ocean sediments, and the atmosphere. Humans impact this cycle in many ways including the burning of fossil fuels, deforestation, and sewage runoff.
Phosphorus Cycle: Phosphorus is a limiting factor for plant growth and is cycled through the environment by erosion of sediments, runoff, absorption of plants and the movement through the food chain. Major reservoirs of phosphorus include deep ocean sediments, rocks, and organisms. Mining and fertilizers impact this cycle.
Sulfur Cycle: Sulfur is stored in rock and ocean sediments, it cycles through the system being released by volcanoes, uptake by plants, sea spray and use of fossil fuels. Reservoirs are rocks, ocean sediments and organisms. Humans impact this cycle by use of fossil fuels and smelting.
Scientific Process: Sometimes referred to as the scientific method, this is a series of steps, not always the same, that scientists use to solve a problem. The scientific process aims to explain the natural world, relies on evidence, involves the scientific community and leads to ongoing research.
Matter: Anything that has mass and volume. It is living and non living things. It is what everything is made up of and includes protons, neutrons and electrons, elements, compounds, molecules and in living things, cells, tissues, organs, organ systems, and organisms.
Energy: The ability to do work and transfer heat. It can be potential or kinetic energy and follows the laws of thermodynamics.
Text Version
Lesson Review: Reading Guide
As you read your text, keep an eye out for the answers to the following questions. Use the reading guide worksheet to take notes as you go along.
- What is biodiversity and why is it important?
- Where do species come from?
- How go geological processes and climate change affect evolution?
- What is species diversity and why is it important?
- What roles do species play in ecosystems?
- How do species interact?
- How can natural selection reduce competition between species?
- What limits the growth of populations?
- How do changing communities and ecosystems respond to changing
environmental conditions?
Unit Review: Reading Guide
As you read your text, keep an eye out for the answers to the following questions. Use the reading guide worksheet to take notes as you go along.
- Identify questions and problems that can be answered through scientific investigation.
- Identify the different forms and quality of energy.
- Perform calculations and conversions using different units of energy.
- Explain how geological processes affect ecosystem formation and function.
- Explain the cycling of water, carbon, nitrogen, phosphorus, sulfur and other nutrients in ecosystems
- Define ecology.
- Explain the roles that organisms, communities, and populations play in the functioning of an ecosystem.
- Explain the flow of energy through an ecosystem using the laws of thermodynamics, food webs, food chains, and eco-pyramids.
- Explain the process of ecological succession in ecosystems.
- Define biodiversity and explain the importance of biodiversity to the health of the biosphere.
- Describe the role of adaptation, natural selection, and extinction in the process of evolution.
- Calculate growth rates and doubling times of populations as well as project the future population size of a community.
- Analyze factors that limit the growth of populations.
 Graded Assignments
Congratulations on completing this lesson! In this lesson you learned about:
- Define biodiversity and explain the importance of biodiversity to the health of the biosphere.
- Describe the role of adaptation, natural selection, and extinction in the process of evolution.
- Explain how evolution and ecological succession work together in the formation of ecosystems.
- Calculate growth rates and doubling times of populations as well as project the future population size of a community.
- Analyze factors that limit the growth of populations.
Please return to your Schoology classroom L4 - Biodiversity and Evolution folder to complete any graded assignments for this lesson.

