 Interpreting Geologic Time on Geologic Maps
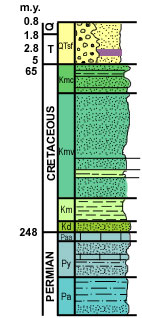
When you were learning how to read, you had to first understand what sounds all the letters represented and how they could come together to form words. When you started learning how to do math, you had to first understand the common symbols used in math so you could carry out basic operations. Likewise, in geology, there are some common symbols that are used to convey a message. In the case of geologic maps, symbols tell a history story. The image here shows what is called a stratigraphic column. Images and symbols like the ones you see here are commonly found on geologic maps.
On the column shown here, each color corresponds to a different type of rock. You would know that anytime you saw that color on the map, rocks in that given area were of the ages shown here. For example, all blue areas on the map would indicate rocks that formed during the Permian, or about 299 to 251 million years ago. Notice that the column is shown with the oldest symbols at the bottom and that it gets progressively younger toward the top. This will always be the case on geologic map keys.
Sometimes the names of each geologic period will be written out, such as "Cretaceous" or "Permian." But at other times, only a symbol for each period will be given. The first part of the symbol corresponds to a period of geologic history. Some of these symbols are summarized below.
- Pre€ Precambrian – anything before the Phanerozoic Eon
- € Cambrian
- P Permian
- Tr Triassic
- J Jurassic
- K Cretaceous
- Q Quaternary
- QT Quaternary/Tertiary (a time that includes all of the Cenozoic Era)