 Section Warm-Up
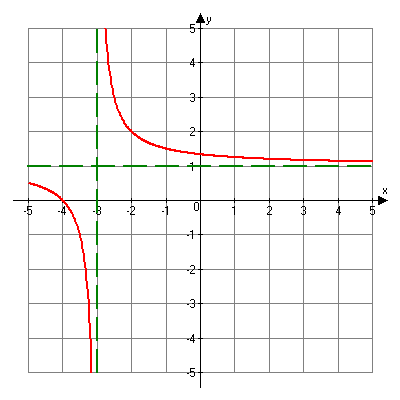
In the previous section you learned about the general forms of direct and inverse variation equations and how they look graphically. Before beginning our work in this section, let’s take a closer look at the inverse variation equation. The following is the graph of ![]() .
.

![]()
Notice the two green dashed lines in the graph. What do you think those represent? These lines are called vertical and horizontal asymptotes.
Vertical Asymptote
Vertical asymptotes are lines where the graph is undefined. Take a look at x = -3:
When x = -3 the denominator of the equation is zero which is not allowed. This means x = -3 is an excluded value, which is represented by a vertical asymptote.
Horizontal Asymptote
Horizontal asymptotes are lines that the graph approaches as x gets larger and larger in either the positive or negative direction.
Take a look at the values of the function as x gets larger in the positive direction :
| x |  |
| 10 |  |
| 100 |  |
| 1000 |  |
| 10,000 |  |
Notice that the value of y is approaching 1.
Now take a look at the values of the function as x gets larger in the negative direction :
| x |  |
| −10 |  |
| −100 |  |
| −1000 |  |
| −10,000 |  |
Notice, again, that the value of y is approaching 1. Since the value of y is approaching 1 as x gets larger and larger, the line y = 1 is a horizontal asymptote.
Keep this discussion of asymptotes in mind as we start to graph rational functions and find the domain and range of these functions.
