Graphing Trigonometric Functions: Introduction

Trigonometric Curves
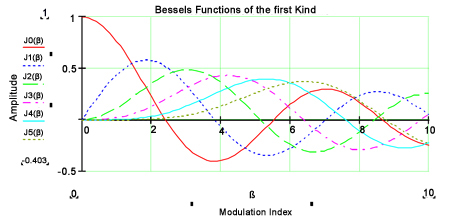
Compare the different curves shown above. What is similar about them? What is different? Can you see that each curve goes up and down, up and down? They oscillate between their highest value and their lowest value over and over again. Some are taller than others and some are more “stretched out” than others, meaning that they take longer to get to their highest point and back to their lowest point. These curves are all based on the trigonometric functions we are going to study in this section. They could represent anything from sound and light waves, the waves made by an earthquake, all the way to a person’s heart rate. In this section, we are going to study the graphs of the very basic curves, but once you learn those, it is not difficult to extend them to more complicated curves.